What Happened — 174% in 18 Months
Newmont Corporation (NYSE: NEM) has delivered one of the most impressive rallies in the entire mining sector. From its low of approximately $30 in autumn 2024 — when the Newcrest integration was stumbling and the market had punished the stock — to its current price of approximately $55-60, the stock has nearly tripled. The primary driver is clear: gold above $2,900/oz, a level that even the most bullish analysts would not have predicted two years ago.
As the world's largest gold producer, Newmont benefits disproportionately from this gold price boom. The margin between AISC (All-In Sustaining Costs) at roughly $1,400-1,450/oz and gold at $2,900+ creates a per-ounce profit margin of over $1,300 — a level that generates extraordinary cash flows and has driven the stock's re-rating from deeply discounted to fairly valued in a remarkably short period.
Record Cash Flows — The Numbers Speak
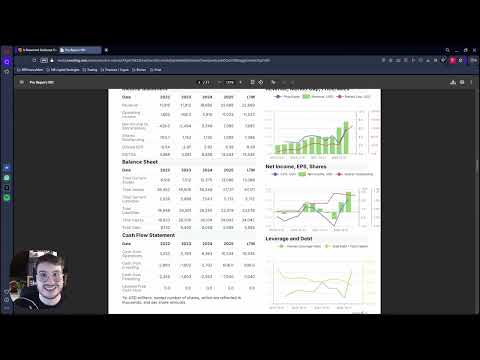
Newmont's 2025 financial results were impressive by any standard. The company reported operating cash flow exceeding $7.5 billion and free cash flow of approximately $4.5-5.0 billion — both all-time records in the company's century-long history. Against a market capitalization of roughly $70 billion, this translates to an FCF yield of approximately 6-7%. While not cheap in absolute terms, this is a substantial cash generation engine that funds debt reduction, dividends, buybacks, and reinvestment simultaneously.
The AISC of approximately $1,400-1,450/oz positions Newmont in the middle of the cost curve among major gold producers — not the lowest cost, but supported by the sheer scale of operations across six continents. At gold above $2,500/oz, even mid-cost producers generate exceptional margins, and Newmont's diversified portfolio provides resilience against individual mine disruptions.
The Production Problem — 10% Less Gold
Here is where the narrative gets complicated. While cash flows are exploding upward, gold production is heading in the opposite direction. For 2026, Newmont guides to approximately 5.3-5.6 million ounces — roughly 10% below the 5.9 million ounces produced in 2025. Three factors explain this decline:
- Portfolio rationalization: Newmont has been actively divesting non-core assets acquired through the Newcrest merger — including mines in Canada, Ghana, and Australia. This reduces total production but improves average profitability per ounce as marginal assets are shed.
- Mine sequencing: Several Tier-1 mines are transitioning from open-pit to underground operations (notably Tanami and Ahafo), causing temporary production dips during the changeover periods before higher-grade underground ore becomes accessible.
- Grade variability: Natural fluctuations in ore grades across the portfolio affect quarterly and annual output, particularly at Boddington (Australia) and Penasquito (Mexico).
Importantly, less gold does not necessarily mean less value. Newmont's strategy is deliberate: focus on the most profitable ounces, divest marginal operations, and optimize the portfolio for cash flow rather than headline production. At gold above $2,500/oz, the margin per ounce matters far more than the total number of ounces — quality over quantity.
Valuation — Too Expensive After the Rally?
This is the central investor question. At a forward P/E of approximately 14-16x, Newmont is no longer cheap — neither in absolute terms nor relative to its historical range. Gold miners have traditionally traded at 8-12x earnings. However, the current environment is unusual: gold at all-time highs, cash flows at records, balance sheets clean post-Newcrest deleveraging, and geopolitical tailwinds (central bank buying, de-dollarization, persistent inflation) supporting the gold price thesis.
The valuation is justified if you believe gold sustains above $2,500/oz. Central bank purchases, geopolitical fragmentation, and real negative interest rates in many economies support this view. If gold corrects to $2,000-2,200/oz, however, Newmont's margin compresses by 30-40% and the P/E stretches to 20-25x — clearly expensive. This makes Newmont a high-conviction gold price bet rather than a traditional value investment.
Dividend & Capital Returns
Newmont pays a base dividend of approximately $1.00/share annually (roughly 1.8-2.2% yield) supplemented by variable special dividends and share buybacks. Relative to the record cash flows, the dividend yield is modest — the company prioritizes post-Newcrest debt reduction and reinvestment. For yield-focused investors seeking 5-10% dividends, Barrick Gold (higher yield, lower P/E) or B2Gold (smaller producer, higher yield) offer more compelling income propositions. Newmont is a gold price leveraged growth play, not a high-yield income stock.
Key Risks
- Gold price correction: A decline to $2,000-2,200/oz would materially compress margins and push the forward P/E into expensive territory. Newmont's stock price is highly correlated with gold.
- Production decline: A 10% production drop combined with cost inflation could pressure cash flows if gold does not continue to rise.
- AISC inflation: Industry-wide cost pressures (diesel, labor, explosives, equipment) are real. An AISC increase toward $1,600+/oz would noticeably reduce per-ounce margins.
- Geopolitical risk: Operations in Peru (Yanacocha), Suriname (Merian), and Ghana (Ahafo) expose Newmont to political instability, community conflicts, and regulatory changes.
- Valuation premium risk: After a 174% rally, the market is pricing in a best-case scenario. Any disappointment on production, costs, or gold price could trigger an outsized selloff.
Investment Thesis
Newmont remains the blue-chip standard among gold miners — the portfolio, reserves, scale, and cash flow generation are best-in-class. However, after a 174% rally and a forward P/E of 14-16x, the margin of safety has shrunk considerably. For existing holders, the position is worth maintaining as long as the gold bull thesis holds — the record cash flows, clean balance sheet, and buyback program provide ongoing shareholder value. For new investors, I see better risk-reward opportunities among cheaper gold miners: Barrick Gold (lower P/E, higher dividend yield) and B2Gold (smaller producer with more upside leverage to gold). Newmont is not overvalued, but it is no longer the screaming buy it was 18 months ago. My recommendation: add to the watchlist and look for entries on any correction toward the $45-48 range.
Understanding FCF for dividends? → Free Cash Flow Explained: Why FCF Is the Only Metric That Matters →
🇩🇪 Deutsche Version: Diesen Artikel auf Deutsch lesen | 🌐 MB Capital Strategies (DE)
