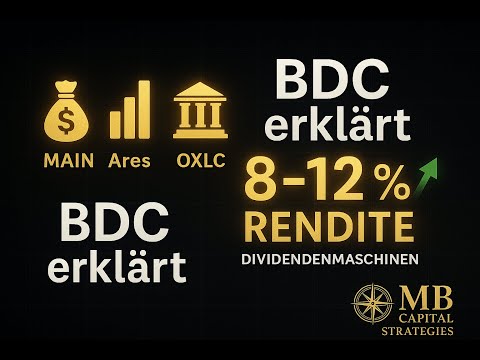
BDCs Explained: 3 Dividend Machines With 8-12% Yield
What Are BDCs and Why Do They Pay 8-12% Dividends?
Business Development Companies (BDCs) lend to middle-market US companies and must distribute 90% of taxable income — hence 8-12% yields. Top BDCs like Hercules Capital (HTGC) and Ares Capital (ARCC) have decades of stable payouts. Risk: credit defaults rise in recessions. BDCs are rate-sensitive — they benefit from floating-rate loans in high-rate environments. Not investment advice. — best high yield dividend stocks
BDCs explained: Business Development Companies pay 8–12% dividends by lending to mid-market firms. How MAIN Street, Ares Capital and Hercules Capital work — and what to watch.
BDCs (Business Development Companies) Explained: Business Development Companies (BDCs) are US closed-end investment vehicles required to distribute 90%+ of taxable income — creating yields of 8–14%. They lend to mid-market US companies (private credit). Key risk: credit defaults in recessions, especially in floating-rate loan portfolios. Marco's BDC ranking 2025–2026: Tier 1 (conservative, low defaults) = Hercules Capital (HTGC, tech/life-sciences), Blue Owl Capital; Tier 2 (higher yield, more risk) = Newtek, PennantPark. What to watch: non-accruals rate (defaults climbing = dividend cut risk), NAV/share trend (must stay above par), leverage ratio (below 1.5x debt/equity is healthy for BDCs).
BDCs Explained: 3 Dividend Machines With 8-12% Yield
idend Machines With 8-12% Yield Thumbnail" width="480" height="360" loading="lazy" decoding="async">
BDCs Explained: 3 Dividend Machines With 8-12% Yield
Key Takeaway: BDCs are closed-end investment companies that lend to mid-market businesses (€10M–$250M revenue). By law they must distribute 90%+ of taxable income — which is why yields of 8–12% are structurally sustainable, not accidentally high.
What Is a BDC?
A Business Development Company (BDC) is a type of closed-end investment fund that provides financing to small and mid-sized businesses that lack access to traditional bank credit or capital markets. The 1980 Small Business Investment Incentive Act created BDCs specifically to fill this funding gap.
BDCs generate income by charging interest rates of 10–15% on loans to portfolio companies, plus fees, equity stakes, and success bonuses. The dividend payout requirement (RIC status) forces them to distribute most of this income — creating the high-yield profile dividend investors seek.
3 Top BDCs: Ares Capital, MAIN Street, Hercules Capital
The video covers three representative BDCs across different risk-reward profiles:
BDC
Focus
Approx. Yield
Risk Profile
Ares Capital (ARCC)
Large, diversified
~9%
Conservative
MAIN Street Capital (MAIN)
Lower-mid market
~6-7%
Low (premium NAV)
Hercules Capital (HTGC)
Tech/life-science VC
~10%
Medium-high
Marco's Take: For European investors, BDCs are accessible via US-listed ADRs. The key risk to understand is US dollar exposure and US withholding tax (typically 15% for German investors with the US-Germany tax treaty). At 9–10% gross yield, even after 15% withholding, the net yield exceeds most European dividend alternatives. The bigger risk is credit quality — during recessions, BDC portfolios experience elevated defaults in their portfolio companies.
Disclaimer: BDCs involve significant credit risk. Past dividend levels are not guaranteed. This analysis is informational only, not investment advice. Always verify current financial data from official company filings.
Business Development Companies explained with three top examples in the video above.
BDC Investing Strategy: How to Screen for Quality BDCs
Business Development Companies (BDCs) offer some of the highest yields in the market — 8-12% is common. But not all BDCs are equal. Here's my screening framework:
The BDC Quality Checklist
NII Coverage >1.0x: Net Investment Income must cover the dividend. <1.0x means the BDC is paying dividends from capital, not income — a red flag.
NAV trend: Is NAV per share stable or growing? Declining NAV over multiple quarters signals portfolio deterioration.
Leverage ratio: <1.5x debt/equity is conservative. Above 2x increases risk during a credit cycle downturn.
Portfolio quality: % first lien loans, % floating rate (beneficial in rising rate environment), default rate history.
Manager track record: Internally managed BDCs (like Main Street Capital) often have better alignment. External management can lead to fee bloat.
BDCs I Follow Closely (not buy recommendations)
Main Street Capital (MAIN): The gold standard. Internally managed, monthly dividend, conservative leverage. Premium to NAV is deserved — premium management commands premium price.
Ares Capital (ARCC): Largest BDC by AUM. Diversified portfolio, consistent NII >1.0x, proven through multiple cycles. Lower yield (~9%) but more resilient.
Hercules Capital (HTGC): VC-adjacent. Higher risk/reward, technology company focus. Excellent for investors who understand venture debt.
BDC Tax Note for German Investors
BDC dividends are typically classified as ordinary income in the US — not qualified dividends. German investors pay 25% Abgeltungssteuer + Soli. The 15% US withholding tax is credited against German tax. Net effect: similar to regular dividend stocks.
Rising Rates: The Hidden BDC Tailwind
Most BDC portfolios are predominantly floating rate loans. When the Federal Reserve raises rates, BDC Net Investment Income (NII) rises almost immediately because the interest income from variable-rate loans increases. This is the opposite of REITs and bond-like instruments, which suffer in rising rate environments.
In 2022-2024, BDC NII increased dramatically — Ares Capital's NII per share rose from ~$1.70 (2021) to $2.30+ (2024) — directly reflecting SOFR increases from 0% to 5.25%. The dividend increases followed. The risk going forward (2025-2026): if rates fall significantly, NII per share could decline, potentially forcing dividend reductions.
Credit Cycle Awareness: What BDC Investors Often Miss
BDCs are credit investors, not equity investors. Their fundamental risk is borrower default — and borrower defaults are cyclical. In the 2008-2009 credit crisis, some BDCs cut dividends 40-60% and saw NAV per share collapse. Even the best BDCs are not immune to a severe credit cycle downturn.
My framework: I allocate to BDCs in the middle of a credit cycle — after defaults have peaked and before the next expansion mints excessive risk-taking. I reduce exposure as credit conditions loosen and leverage across private credit markets reaches extreme levels. Signs of a deteriorating credit environment: rising non-accrual rates, declining NII coverage, NAV erosion quarter-over-quarter.
BDCs vs. Shipping in a Dividend Portfolio
Both BDCs (8-12% yield) and shipping stocks (8-15% variable yield) are high-yield, capital-intensive sectors. The structural difference:
BDCs: Credit cycle exposure, floating rate income, regulatory 90% income distribution requirement. Dividend stability depends on borrower health.
Shipping (contract-based like FLEX LNG): Asset-backed, long-term contracted income, physical asset as collateral. Dividends backed by vessels that retain residual value.
Shipping (spot-exposed like TORM): High upside in cycle peaks, variable dividends, but cash generation is transparent and checkable from TCE data.
In a diversified hard-asset dividend portfolio, I use both — BDCs for interest-rate sensitivity and credit cycle exposure, shipping for commodity cycle and physical asset collateral. Neither replaces the other. Maximum allocation I would take to BDCs as a category: 10-15% of total portfolio.
Not investment advice. BDCs carry credit risk. Research individual companies and understand the risks before investing.
BDC Portfolio Construction: How I Actually Size These
BDCs are not a core holding for my portfolio — they are a satellite position. Here is the sizing framework I use:
Maximum BDC allocation: 10-15% of total portfolio. Beyond that, credit cycle risk becomes too concentrated and correlation with fixed income increases.
Prefer managed income BDCs over pure equity BDCs. BDCs that invest in senior secured loans (e.g. Ares Capital, FS KKR) have lower default recovery risk than those heavily weighted to equity co-investments.
Net Asset Value (NAV) per share is the anchor metric. If a BDC is trading at a significant premium to NAV, you are paying more than the underlying loan book is worth. I generally only buy BDCs at NAV or discount.
Dividend coverage ratio must be >100%. If the BDC pays more in dividends than it earns in net investment income (NII), it is eroding NAV. That is a red flag, not a feature.
In my hard-asset dividend portfolio, BDCs complement shipping and mining by providing interest-rate-sensitive income that tends to hold up (or increase) in rising rate environments — when many of my shipping names are under charter pressure. The combination creates a partial natural hedge.
We use cookies and Google Analytics to improve your experience. By clicking "Accept", you consent to the use of cookies for analytics and ads. Privacy Policy