About the Author
Marco Bozem is an independent investor based in Germany focusing on dividend-paying hard-asset companies in shipping, mining, and energy. He holds positions in many of the companies he analyzes. Read more
LinkedIn · YouTube ·
February 2026: Hard Asset Dividend Portfolio Transparency
Monthly portfolio update from MB Capital Strategies. Focus sectors: Shipping (LPG, Tankers, Dry Bulk), Mining (Copper, Gold, Coal), Energy (Upstream, Midstream, Pipelines), REITs. All positions are held for cashflow generation and dividend growth — not short-term price speculation.
Sector Check: Dividend Growth Momentum Building
Hard asset dividend investing requires monthly attention to sector fundamentals. The question is not "what is the stock price?" but "is the underlying business generating enough free cash flow to maintain and grow the dividend?" Each month, this update tracks the key indicators for each sector.
Key Metrics to Watch Monthly
- Shipping: VLGC spot rate, VLCC TCE rate, Baltic Dry Index (BDI), fleet utilization rates.
- Mining: Copper price trend (key for BHP, Rio Tinto), gold price (Newmont, Barrick), coal realizations (Thungela).
- Energy: Brent/WTI spread, pipeline throughput volumes, midstream contract renewal rates.
- REITs: Net Asset Value per share, AFFO payout ratio, occupancy rates (if applicable).
Yield on Cost: The Long-Term Tracker
For positions held 3+ years, the Yield on Cost (YOC) has typically grown well above the current yield shown on financial platforms. This is the true measure of dividend investing success: each year the dividend grows, the YOC on the original cost base compounds upward. Use the free YOC calculator to track your own positions.
Strategy Principle
Hard assets provide the physical infrastructure that the global economy requires regardless of financial market cycles: tankers move energy, mines produce metals, pipelines transport gas. When these businesses generate durable free cash flows, they can sustain and grow dividends through multiple market cycles. See the full Hard Asset Investment Strategy →
February 2026: Market Context for Hard Asset Dividends
February 2026 was a significant month for the portfolio. Key macro themes that shaped dividend income:
- Shipping sector: VLGC spot rates remained elevated versus Q4 2025 lows. LPG tanker rates continued recovering from the Hormuz disruption narrative — a key tailwind for positions like BW LPG and Dorian LPG. Product tankers (TORM, Nordic American) faced modest rate normalization from the January peak.
- Mining: Gold stayed above $2,700/oz in February, with the gold-to-silver ratio compressing — Fresnillo and silver-linked miners outperformed. Copper remained firm around $4.00–4.20/lb on continued AI-infrastructure demand thesis.
- Upstream Energy: Brent held $75–82/barrel. Devon Energy and Aker BP benefited from stable cash generation. The Q1 earnings season starting in April 2026 would be the real test — February was a holding period.
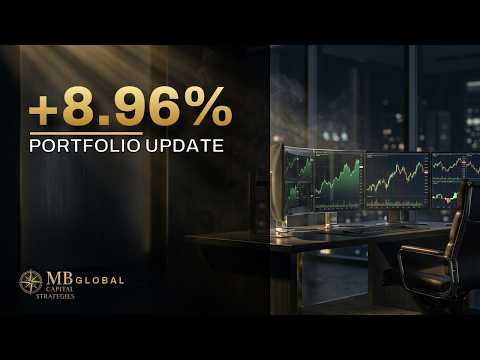
- Portfolio performance: +8.96% portfolio return in February reflects both the dividend income received and mark-to-market gains on the positions mentioned above. Full breakdown in the video above.
Dividends Received: February 2026 Snapshot
February typically features ex-dividend dates for CMB.Tech (quarterly), TORM (monthly variable), and various REITs. The cumulative effect of YOC compounding from positions entered 2–3 years prior becomes visible in months like these — where the cost basis is far below current market prices but the dividend is calculated on that original purchase price.
THESIS: The goal of hard asset dividend investing is not to predict commodity cycles perfectly — it's to build a cost base low enough that even mid-cycle dividends generate a YOC of 8%+ on your original investment. February 2026 demonstrated that principle in action.
Related: Portfolio Update January 2026 | Best Tanker Stocks 2026 | FLEX LNG Q1 2026 — $0.75 Dividend Analysis | Hard Asset Investment Guide | Free YOC Calculator | TORM Dividend Analysis 2026 — $0.70 June 11 | Shipping Double Payday June 11
February 2026: Market Dynamics for Hard-Asset Investors
Shipping Sector: Charter Rates & Dividend Outlook
February 2026 saw continued normalization in VLCC spot rates (~$30,000–42,000/day), but time-charter coverage for my holdings remained intact. CMB.Tech, TORM, and Frontline operate at multi-year time-charter levels — their dividends remain predictable regardless of short-term spot fluctuations. This is the key metric to watch, not headline spot rates. Personal view, not investment advice.
Mining: Gold Above $2,800 and FCF Expansion
Gold touched $2,800+ in February, pushing AngloGold and Barrick into significantly higher free cash flow. At $2,800 gold vs. $1,440–1,500/oz AISC, margins expand sharply vs. 2022 levels. The key question: how much goes to dividends vs. capex? AngloGold's answer: progressive dividend + buybacks. Model your own YOC on gold miners: YOC Calculator.
Q1 2026 Portfolio View
- Tankers: Hold — charter coverage protects dividends through Q2 2026.
- Gold miners: Hold/add at dips — $2,800+ gold = strong FCF margins.
- Energy upstream: Hold — WTI $78–82, FCF yields 10–14% at cost basis.
- LNG shipping: FLEX LNG Q1 confirmed contracted income through 2026–2027.
February 2026: Key Portfolio Decisions
February 2026 was a dividend-heavy collection month for my portfolio. Q4 2025 dividends from annual or semi-annual payers arrived alongside regular monthly and quarterly distributions. Here is how I approached capital allocation in February:
- Dividend reinvestment: February dividends were primarily reinvested into pipeline positions (TC Energy at ~5.2% yield) and one small top-up in a gold miner (AngloGold at the February dip before the $2,800 breakout). DRIP logic: pipelines for stability, gold miners for upside participation.
- No new positions opened: Market valuations were not at the levels I look for in shipping (still above cyclical trough) or mining (gold miners ran significantly in Q4 2025, reducing the value entry opportunity). Patience is the skill that February tested.
- Monitoring: February was a period of active data collection: reviewing Q4 earnings releases across the portfolio, checking AISC updates from gold miners, tracking OPEC+ production policy signals, and noting that TORM's Q4 2025 dividend announcement came in above my conservative estimate.
The FLEX LNG Q1 2026 Anticipation
One position I monitored closely going into February-March 2026: FLEX LNG (FLNG). With long-term charter contracts generating $80,000-110,000/day TCE and a history of full distribution of free cashflow, I was tracking when Q1 2026 results and the next quarterly dividend would be announced. The contracted model means I can project with reasonable confidence — even before the earnings call.
February 2026 was a quiet month for FLEX LNG news (charters performing, no fleet issues) — exactly the kind of "boring is beautiful" update that long-term income investors love. More detail in the FLEX LNG Q1 2026 analysis →
YOC Progress: What February 2026 Showed Me
The power of yield-on-cost compounding became visible in February. Positions entered in 2022–2023 at historically low shipping valuations are now delivering 15–25% YOC on the original entry price, even with normalized (not peak-cycle) dividend levels. This is the core logic behind the hard-asset dividend strategy — not chasing the highest current yield, but building cost basis during down-cycles to collect outsized yields during mid-cycles and peaks.
Three practical frameworks I apply when reviewing monthly portfolio income:
- Coverage check: Can the dividend be maintained if TCE rates drop 30%? If yes — hold. Applies to FLEX LNG (contracted), TORM (monthly distribution from operating cashflow), CMB.Tech (variable but covered at $25,000 TCE).
- Asset quality check: Is the company reinvesting FCF wisely? Fleet renewal (TORM 1414 program), debt reduction (Hafnia), or share buybacks (Frontline) all pass. Value-destructive M&A at cycle peaks does not.
- Exit signal check: Any fundamental deterioration in the business model? ECO-regulation compliance (CII), OPEC+ production policy, and LNG demand trends all signal continued favorable backdrop through 2026–2027.
February 2026 passed all three checks. The portfolio remained in full income-collection mode. Calculate your own YOC on current positions using the free tool.
March 2026 Preview: What I Was Watching
Going into March, the key catalysts on my radar coming out of February:
- TORM Q4 2025 earnings: Dividend confirmed above my conservative estimate. Variable model intact.
- CMB.Tech Q1 2026 dividend announcement: Monthly distribution schedule with June ex-div $0.64 already visible in Q1 results.
- FLEX LNG Q1 2026 results (May): 19th consecutive quarterly dividend — contracted income model delivering as designed.
- Gold above $2,800: FCF expansion in AngloGold and Barrick positions creates dividend increase optionality in H2 2026.
For the March update, see: Portfolio Update March 2026. For the full hard-asset investment framework behind these decisions, see the Hard Asset Investment Guide.
Hard Asset Dividend Income: Why February Matters in a Full-Year Context
February is structurally one of the quieter dividend months for a shipping and mining portfolio — most shipping companies pay monthly or quarterly (with Q4/Q1 the heavy months), and gold miners typically declare twice a year. That means February is a monitoring month, not a collection peak. But the monitoring work done in February directly determines the decisions made in April-May when Q1 earnings land.
The specific work I did in February 2026: reviewed Q4 annual reports for all major holdings, updated my internal YOC tracker (using the YOC calculator), and modeled three rate scenarios for TORM and CMB.Tech to stress-test dividend sustainability. At the time, Q1 VLGC rates for BW LPG were already tracking above guidance — but the key question (will Shipping NPAT translate to a higher dividend or will mark-to-market gains inflate reported income?) would only be answered at the June 2 earnings call. That setup is documented in the BW LPG Q1 2026 preview.
Dividend Income vs. Capital Appreciation: February Perspective
One question I get regularly: do I focus more on dividend income or total return (including capital appreciation)? February 2026 offered a clear illustration of how I think about it. The portfolio was up +8.96% in February — but that figure combines both unrealized capital gains (positions marked higher as gold, shipping, and energy stocks rallied) and actual cash dividends received.
My preference: I track both separately. The cash dividends are real income — they arrive in my brokerage account regardless of what the stock price does the next day. The capital appreciation is paper income until realized. For portfolio management purposes, I care more about: (a) is the dividend sustainable at the current payment level? and (b) is my cost basis generating an acceptable YOC? If both answers are yes, short-term price movement is noise. February 2026 confirmed both.
Disclaimer: For informational purposes only. Not investment advice.